General Instructions
• Reading time – 10 minutes
• Working time – 2 hours and 20 minutes
Topics Assessed
• Data science
• Data visualisation
• Enterprise project
Intelligent systems not included, since the content was not fully covered by the time the trial exams started
Total marks: 80
• Attempt Questions 1-27
• Allow 2 hours and 20 minutes to attempt the questions
Question 1 (1 mark)
Sort the stages below to show the correct order of an enterprise system development process.
- ≡ Researching and Planning
- ≡ Testing and Evaluating
- ≡ Identifying and Defining
- ≡ Producing and Implementing
Question 2 (1 mark)
Which spreadsheet feature would best be used to highlight values over a threshold?
Question 3 (1 mark)
What is the purpose of using primary data?
Question 4 (1 mark)
Which of the following best describes the purpose of OLAP?
Question 5 (1 mark)
Match each type of data visualisation to its most appropriate use.
| Line graph | Pie chart | Bar chart | Scatter plot | |
|---|---|---|---|---|
| Show part-to-whole relationships | ||||
| Compare values across categories | ||||
| Show change over time | ||||
| Show correlation between two variables |
Question 6 (1 mark)
Select all items that are examples of qualitative data.
Question 7 (1 mark)
Select all the statements that describe key purposes of data visualisation.
Question 8 (1 mark)
Select all the examples that are likely to introduce bias into a data visualisation.
Question 9 (1 mark)
Match each example with the correct data type.
| Example | Structured | Unstructured |
|---|---|---|
| Customer reviews on a product | ||
| Excel spreadsheet of invoices | ||
| Security camera footage | ||
| CSV file of employee attendance records |
Question 10 (2 marks)
For each level of measurement, select the most appropriate description and example from the dropdown menus.
| Level of Measurement | Description | Example |
| Nominal | ||
| Ordinal | ||
| Interval | ||
| Ratio |
Question 11 (2 marks)
Select the most appropriate data integrity factor for each situation below.
| Situation | Source | Ownership | Validation | Risk |
|---|---|---|---|---|
| A visualisation includes data from unverified social media sources. | ||||
| A dashboard displays figures that change each time the file is opened. | ||||
| A data visualisation is published without crediting the original data provider. | ||||
| A user is unsure whether the data represents a complete picture of the situation. |
Question 12 (3 marks)
A small business is designing a database to manage staff records. Complete the missing fields in the data dictionary below.
| Field Name | Data Type | Data Format | Field Size | Key | Description |
| EmployeeID | XNNN | Unique ID for each employee | |||
| FirstName | XXX...XXX | Employee's first name | |||
| HourlyRate | $######.## | Employee’s hourly wage | |||
| IsFullTime | Y/N | Whether the employee is full-time | |||
| HireDate | DD/MM/YYYY | Date the employee was hired | |||
| DepartmentCode | XXX | Identifies the employee's department |
Question 13 (2 marks)
A customer places an order through the online website, as shown through the data flow diagram below.
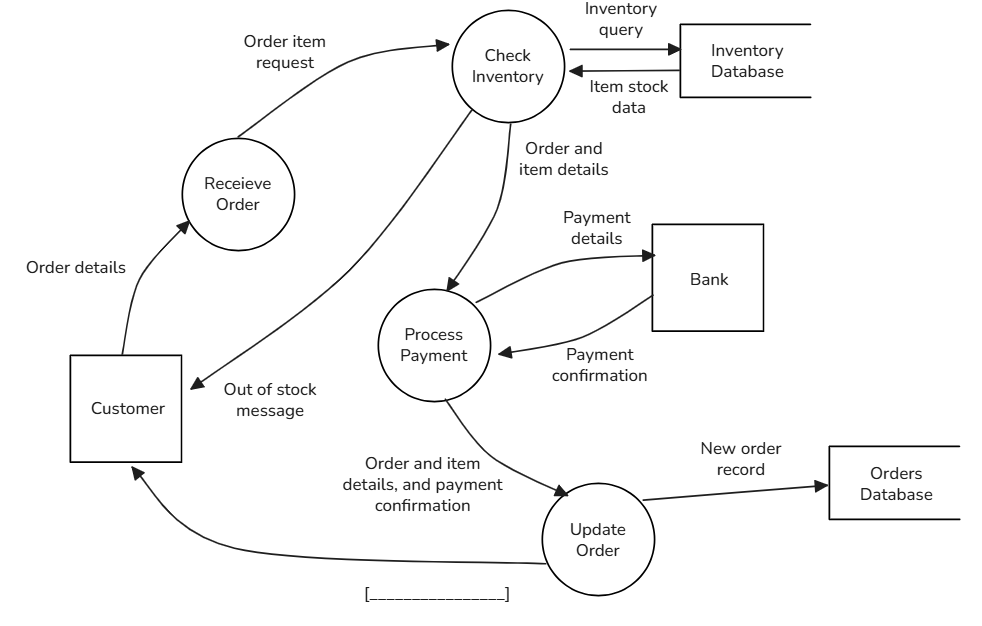
Select the most appropriate option from the dropdowns for each of the following.
Which of the following is a condition that prevents the flow from reaching the Bank?
Which two processes form a critical decision point that determines if the order will be placed or rejected?
On the data flow diagram, the label for the data flow between “Update Order” and the “Customer” is missing. Select the most appropriate label from the options below.
Question 14 (3 marks)
A researcher collects data from customer feedback surveys.
Compare active and passive data collection methods.
Question 15 (2 marks)
A social media platform collects conventional data such as user age, gender, and location.
Describe how one form of alternative data could influence future platform design.
Question 16 (3 marks)
Describe two ways blockchain can ensure the integrity and verification of data in an online voting system.
Question 17 (6 marks)
A company is considering storing sensor data from smart home devices.
Describe one software feature that could affect the privacy or security of user data when accessing the system, and outline its impact. (3 marks)
Explain how the volume and velocity of real-time sensor data may affect system performance and data analysis. (3 marks)
Question 18 (4 marks)
Discuss the impacts of data warehousing on data visualisation.
Question 19 (7 marks)
A company builds a dashboard using spreadsheet software and visualisation tools to monitor its marketing campaign.
Explain how features of spreadsheet software support the collection, processing, and visual representation of data in this scenario. (4 marks)
Justify the use of a dashboard in this scenario. In your response, describe how user experience (UX) considerations can improve the effectiveness of the dashboard for decision-making. (3 marks)
Question 20 (3 marks)
A student creates a data visualisation to show trends in youth voting habits.
Explain how data security should be maintained when publishing this data.
Question 21 (7 marks)
A software development company is building a new online ordering platform for a local restaurant chain. The team is using an agile development approach with frequent client feedback and iterative improvements.
Outline two benefits of using Gantt charts during system development. (2 marks)
Compare and contrast the agile approach with the waterfall model. In your answer, refer to how each approach manages changes in requirements and client involvement. (4 marks)
The restaurant wants to reduce risk during the rollout of the new system by testing it in one store before expanding to all locations.
Which system implementation method is most appropriate for this situation? (1 mark)
Question 22 (6 marks)
A software company is developing an enterprise system for a logistics client. The development team includes offshore developers, remote employees, and several freelancers. During the production phase, the team uses interviews and prototypes to help refine system requirements.
Explain how interviews and prototypes can help the team identify the requirements and limitations of the system. (3 marks)
Discuss how the changing nature of enterprise could affect the development of this project. (3 marks)
Question 23 (3 marks)
A university is building an online system to help determine if students are eligible for an ID card based on the following rules:
- If the student is full-time, they might be eligible for an ID card.
- If the student is on-campus, a further check is done:
- If they are a postgraduate student, they are eligible for an ID card.
- If they are an undergraduate student, a check is done for how many years they have attended:
- If they have attended for 2 years or more, they are eligible for an ID card.
- If they have attended for less than 2 years, they are not eligible for an ID card.
- If the student is not on-campus, they are not eligible for an ID card.
- If the student is on-campus, a further check is done:
- If the student is part-time, they are not eligible for an ID card.
Draw a decision tree diagram that shows all possible decision paths.
Question 24 (3 marks)
A university system stores information about students, courses, and enrolments. The contents of the Students, Courses and Enrolments tables during testing are shown.
Students
| StudentID | FirstName | LastName | DateEnrolled | YearLevel |
|---|---|---|---|---|
| 1 | Alice | Wong | 2021-03-15 | 3 |
| 2 | Brian | Smith | 2023-02-01 | 1 |
| 3 | Clara | Khan | 2020-07-22 | 4 |
| 4 | Daniel | Patel | 2021-09-10 | 2 |
| 5 | Eva | Brown | 2022-03-05 | 3 |
Note: Date is in YYYY-MM-DD format.
Courses
| CourseID | CourseName | Department |
|---|---|---|
| C101 | Intro to Programming | Computer Science |
| C102 | Data Structures | Computer Science |
| C103 | Psychology Basics | Humanities |
| C104 | Networks | Computer Science |
| C105 | Intro to Sociology | Humanities |
Enrolments
| StudentID | CourseID |
|---|---|
| 1 | C101 |
| 1 | C102 |
| 2 | C105 |
| 3 | C104 |
| 4 | C104 |
| 5 | C103 |
Write an SQL query that displays the first name, last name, and year level of students who meet all of the following criteria.
Are enrolled in at least one course from the Computer Science department,
Have been enrolled earlier than 1st Jan 2022, and
Are in Year Level 3 or above.
Note: If a student is enrolled in multiple Computer Science courses that meet the criteria, their name may appear more than once. This is acceptable.
Sort the results by last name in ascending order.
Question 25 (4 marks)
A catering company is managing bookings for events and needs a spreadsheet to calculate costs for each client. They use the number of guests and menu type to determine total charges, and provide a discount if the booking is for more than 100 people.
You are provided with a spreadsheet structure to the right of your screen.
Design formulas for the spreadsheet below to complete the calculations.
Use the lookup table (columns H and I) to retrieve pricing based on the selected menu type. Then calculate total and discounted costs as follows:
- Retrieve the price per person based on the menu type.
- Total Cost = Cost Per Person × Guests
- If more than 100 guests, apply a 10% discount to the total cost; otherwise, no discount.
You must enter a correct spreadsheet formula into each of the six labelled cells (FORMULA 1 to FORMULA 6). Use absolute referencing where appropriate.
Question 26 (3 marks)
A staff member at a company uses a web-based form to request office supplies. Once the form is submitted:
- The request is validated online.
- If valid, the request is stored in the cloud database and a copy is written to the company’s internal DAS system (for backup or analytics).
- The system then displays a confirmation message on the staff member’s screen.
- A copy of the request is also sent to the manager for approval via an internal network.
- The manager later prints a physical copy for their records.
Draw a system flowchart to represent the steps outlined.
Question 27 (8 marks)
A health research organisation is conducting a national survey on mental health trends among teenagers in Australia. Participants are recruited through social media platforms, and data is collected via an online form that includes personal details, health history, and daily habits.
To raise awareness, the organisation publishes an infographic summary of initial findings online. This infographic is widely shared but includes simplified statistics, colour-coded heatmaps of responses by region, and some quotes from anonymous participants.
The organisation also uses third-party AI tools to sort and visualise the data but stores the data on servers hosted overseas. Some Indigenous organisations raise concerns about how youth data from their communities has been used and displayed.

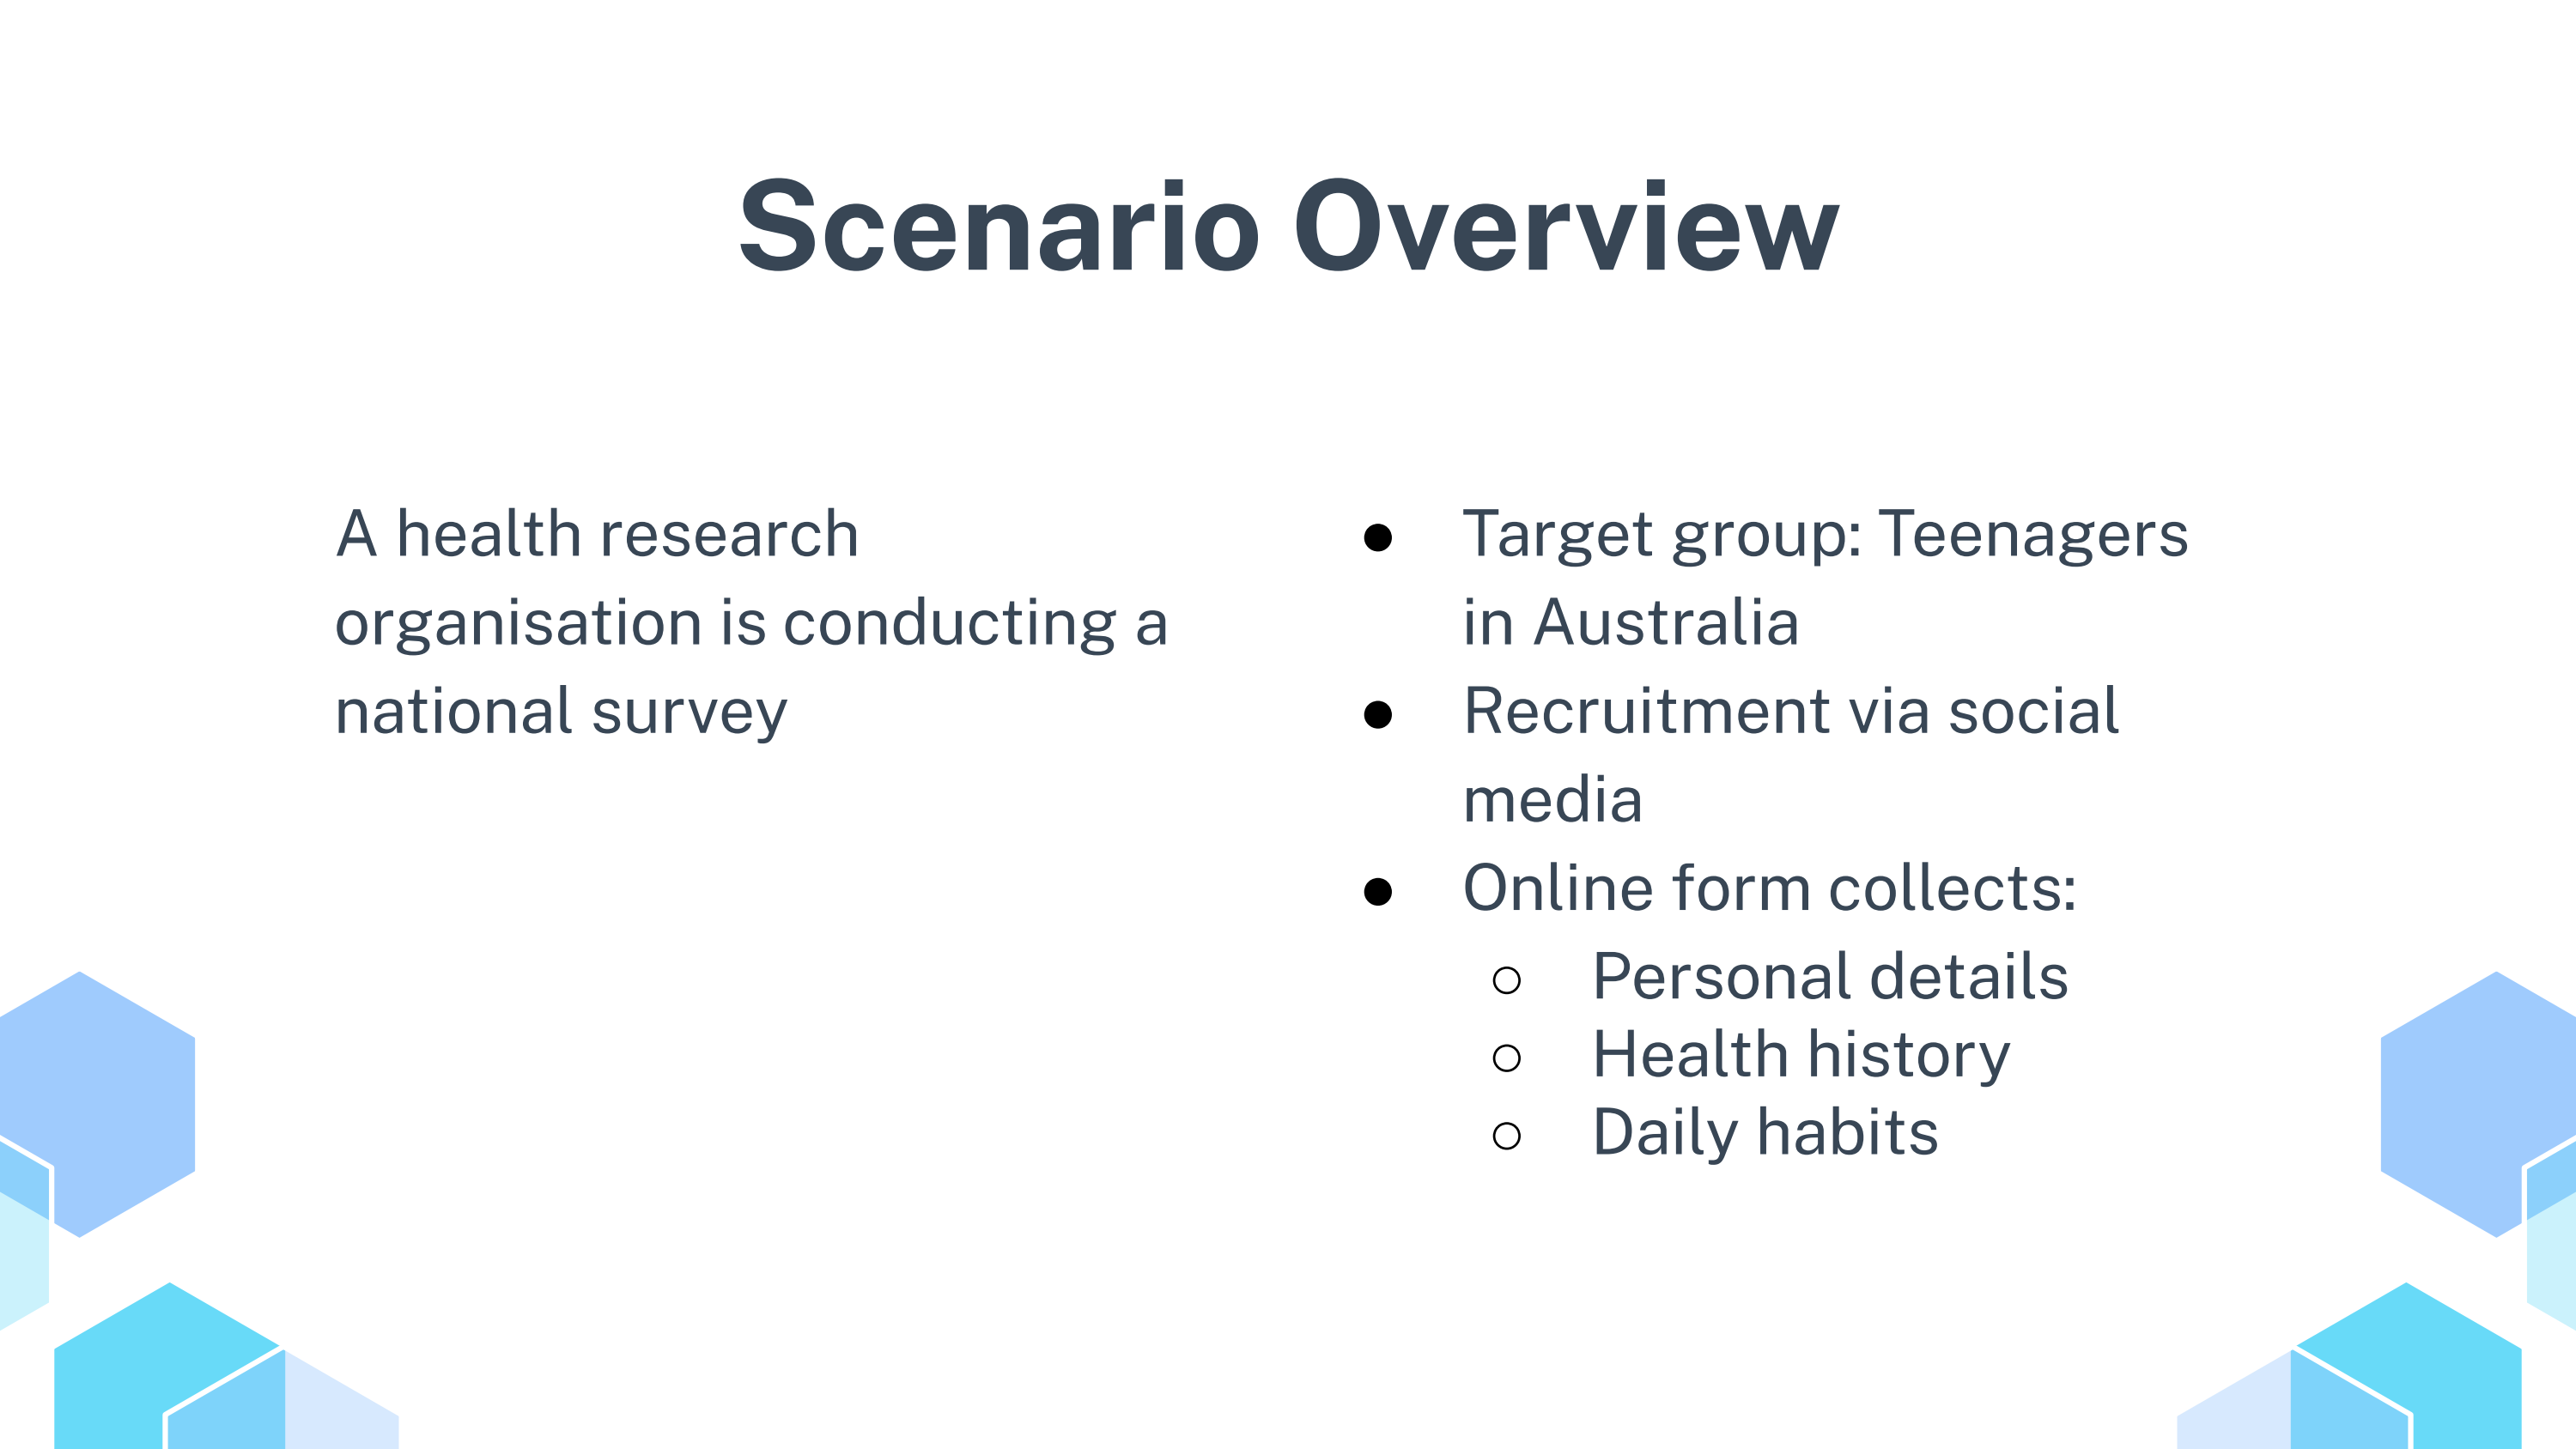
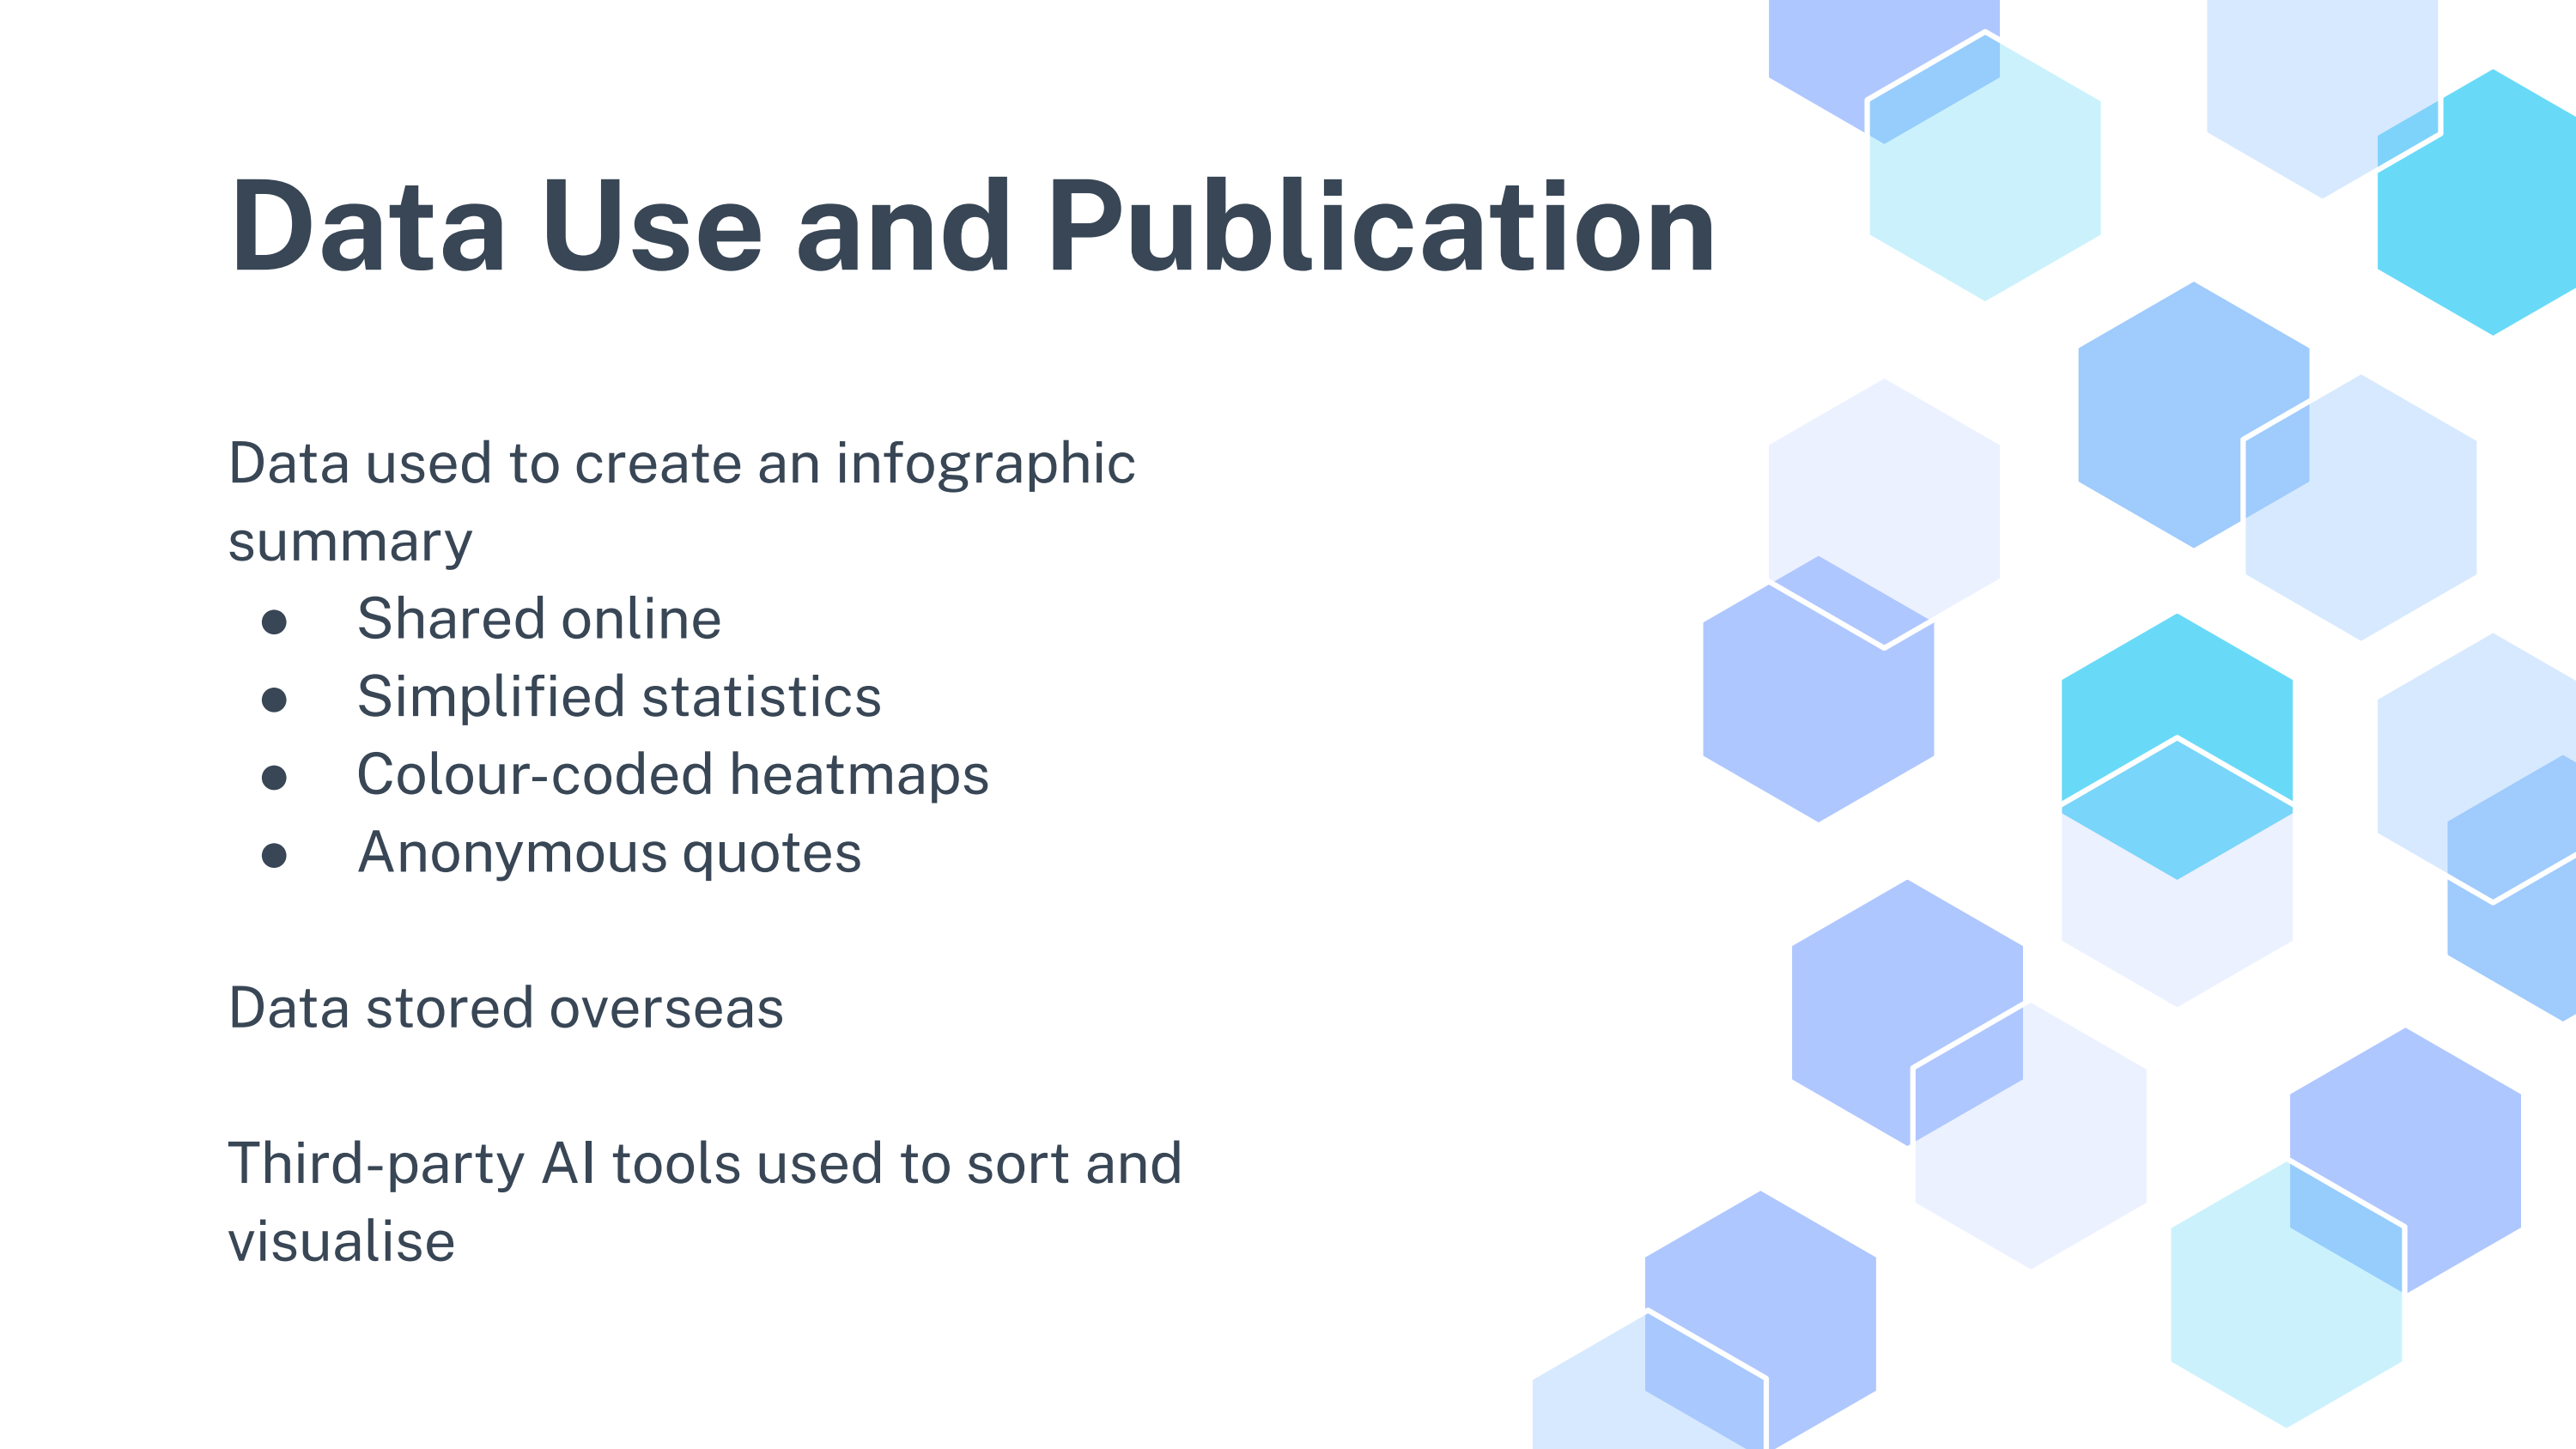
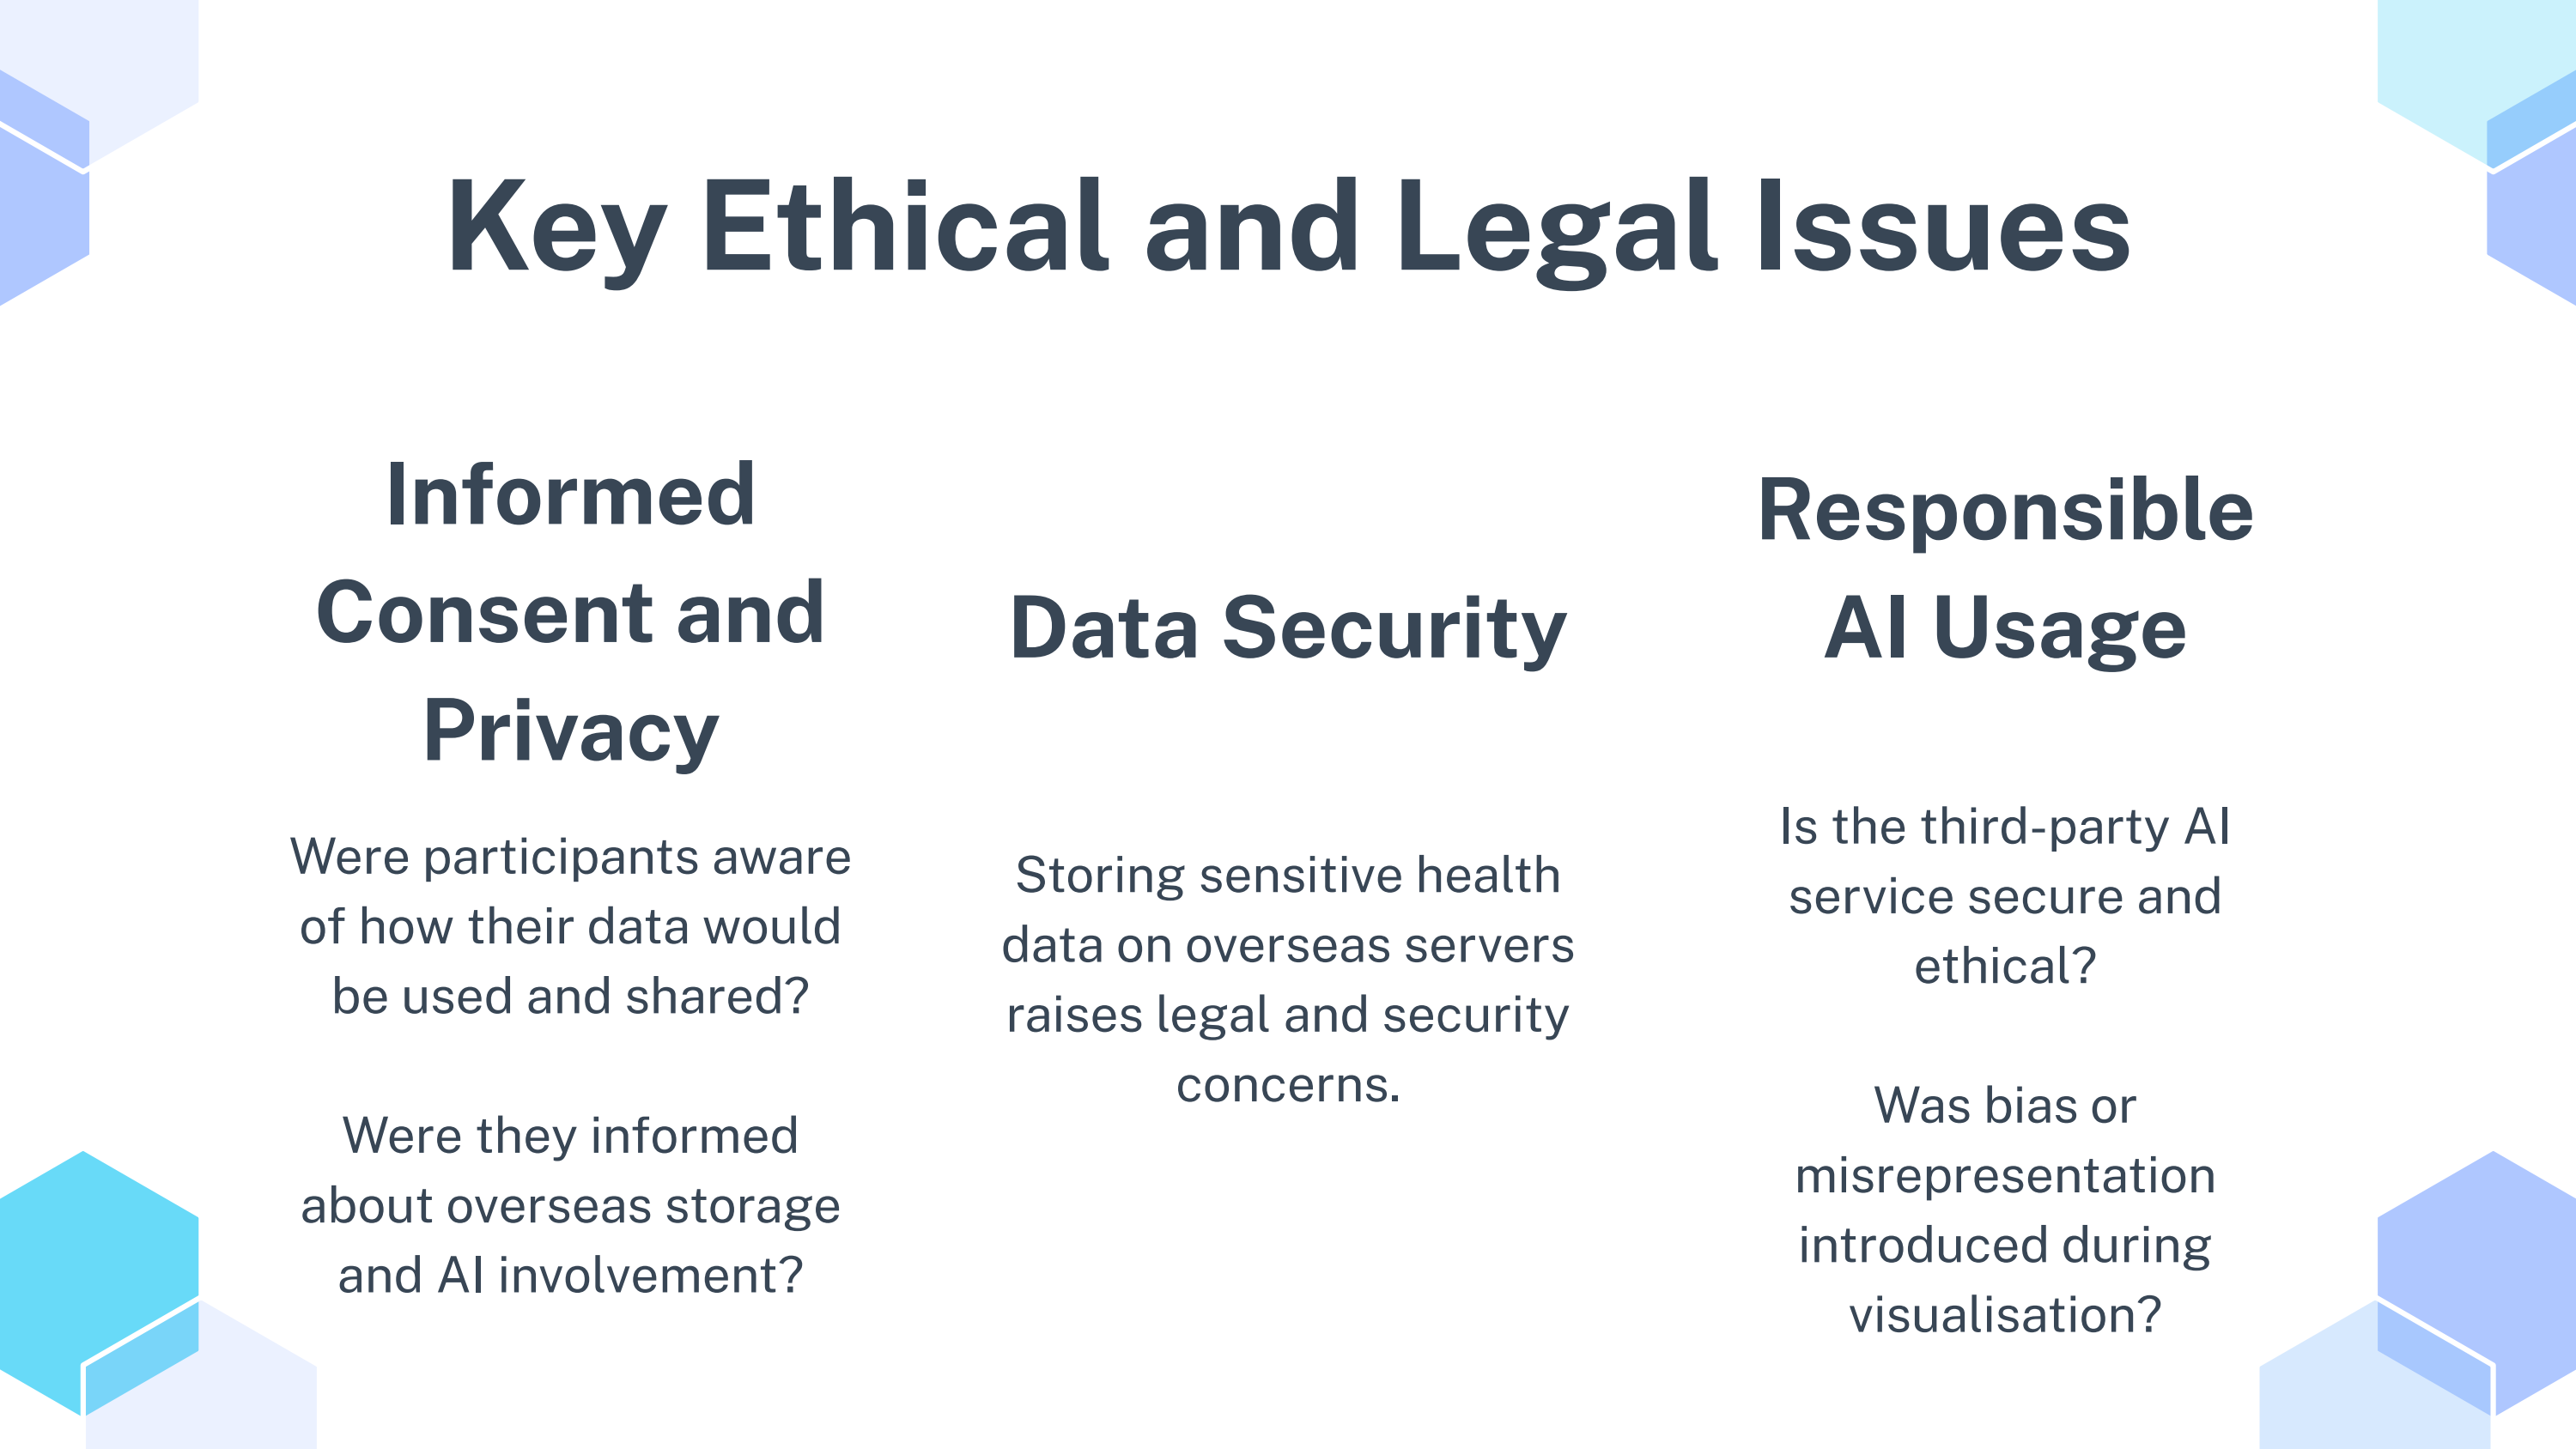
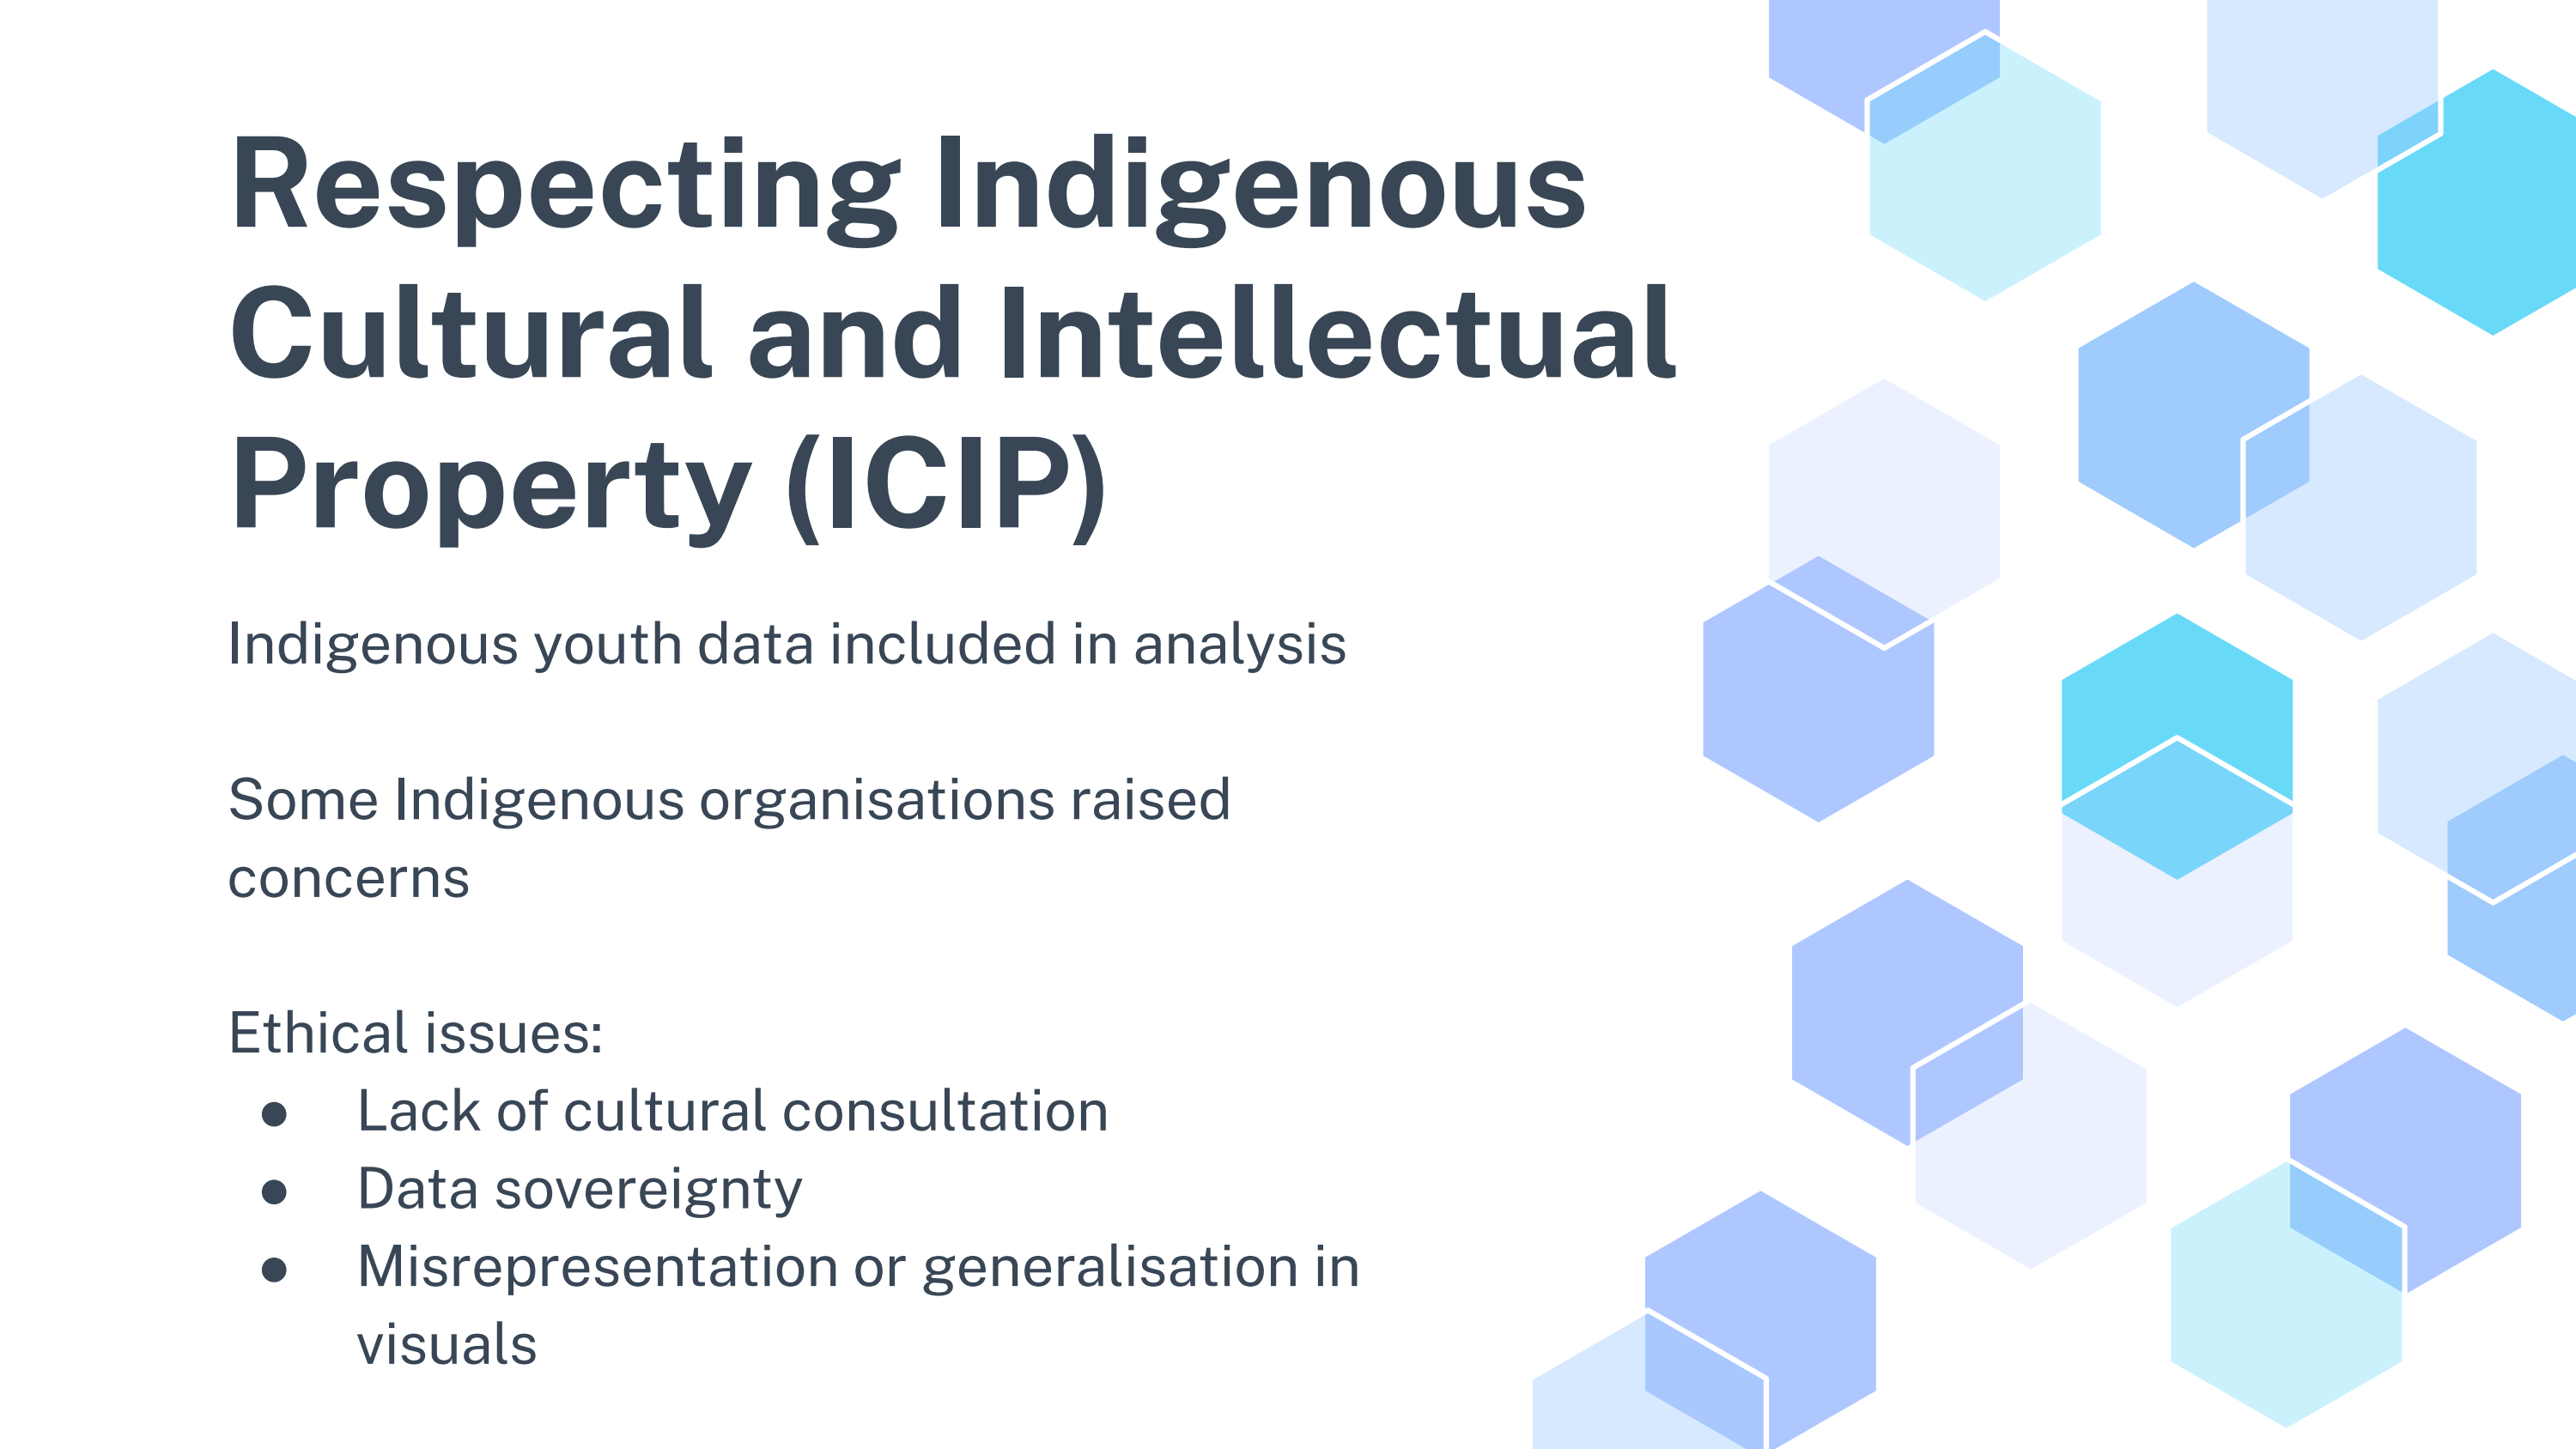
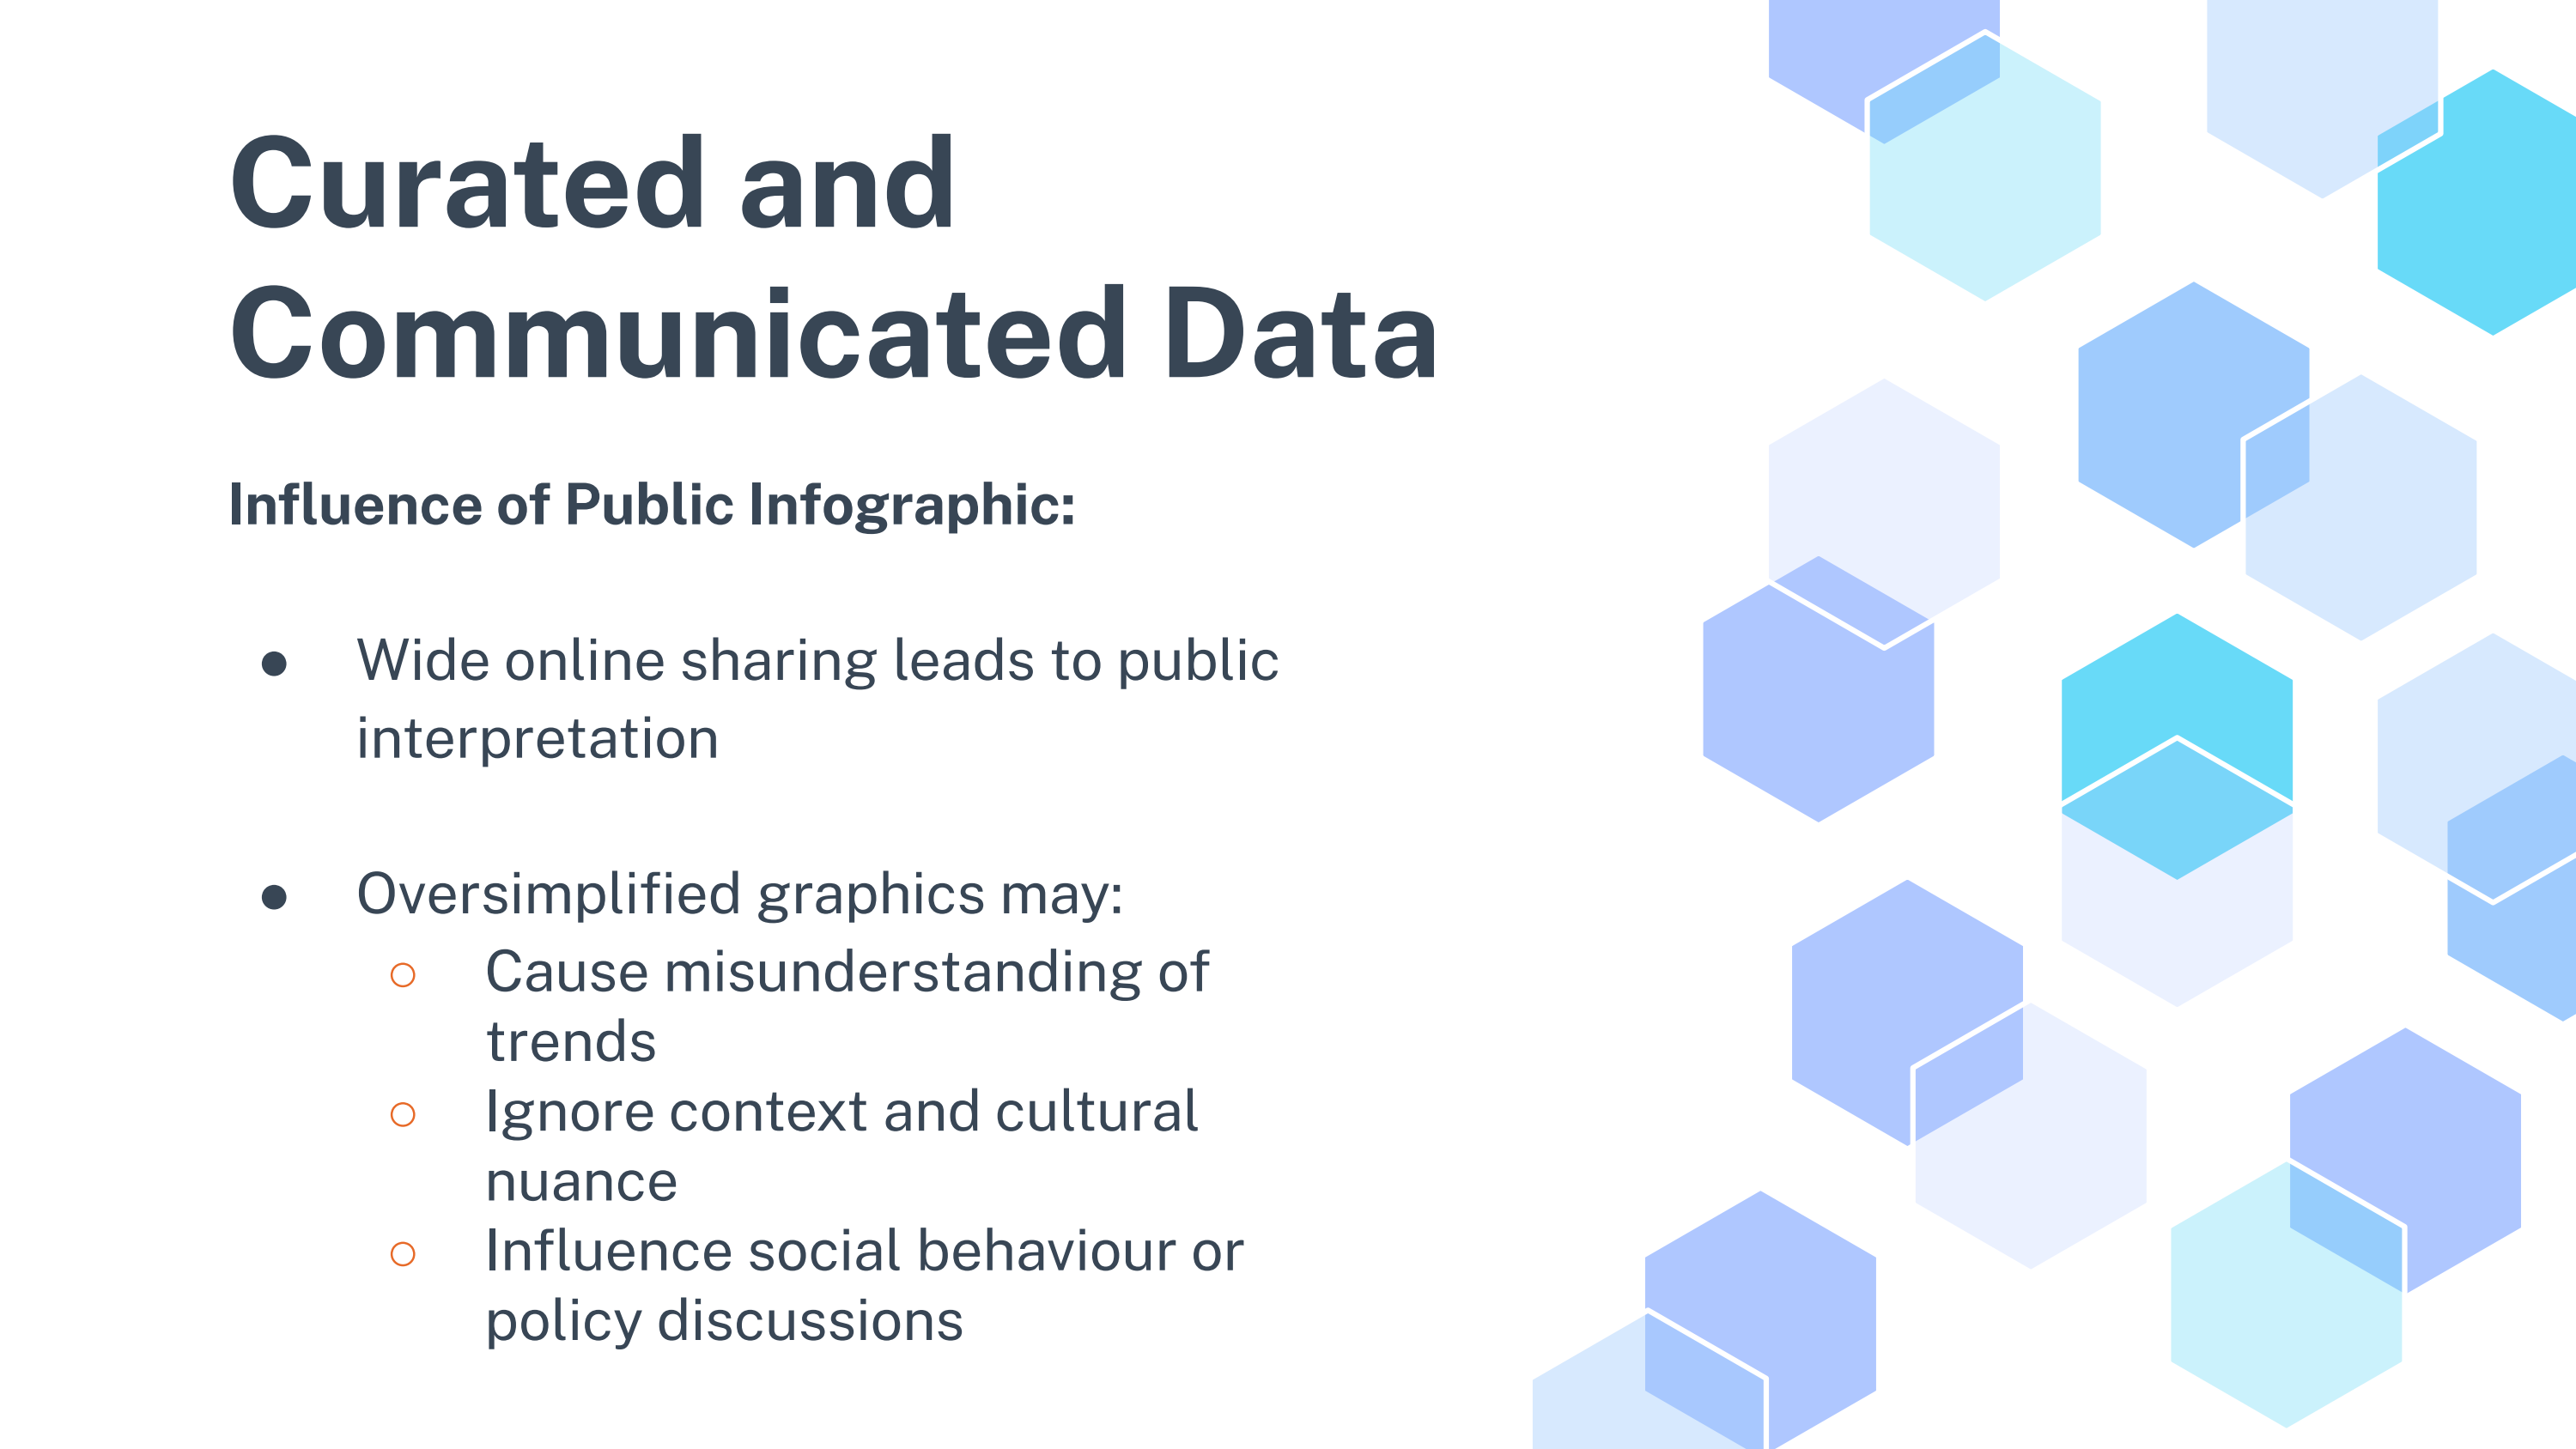
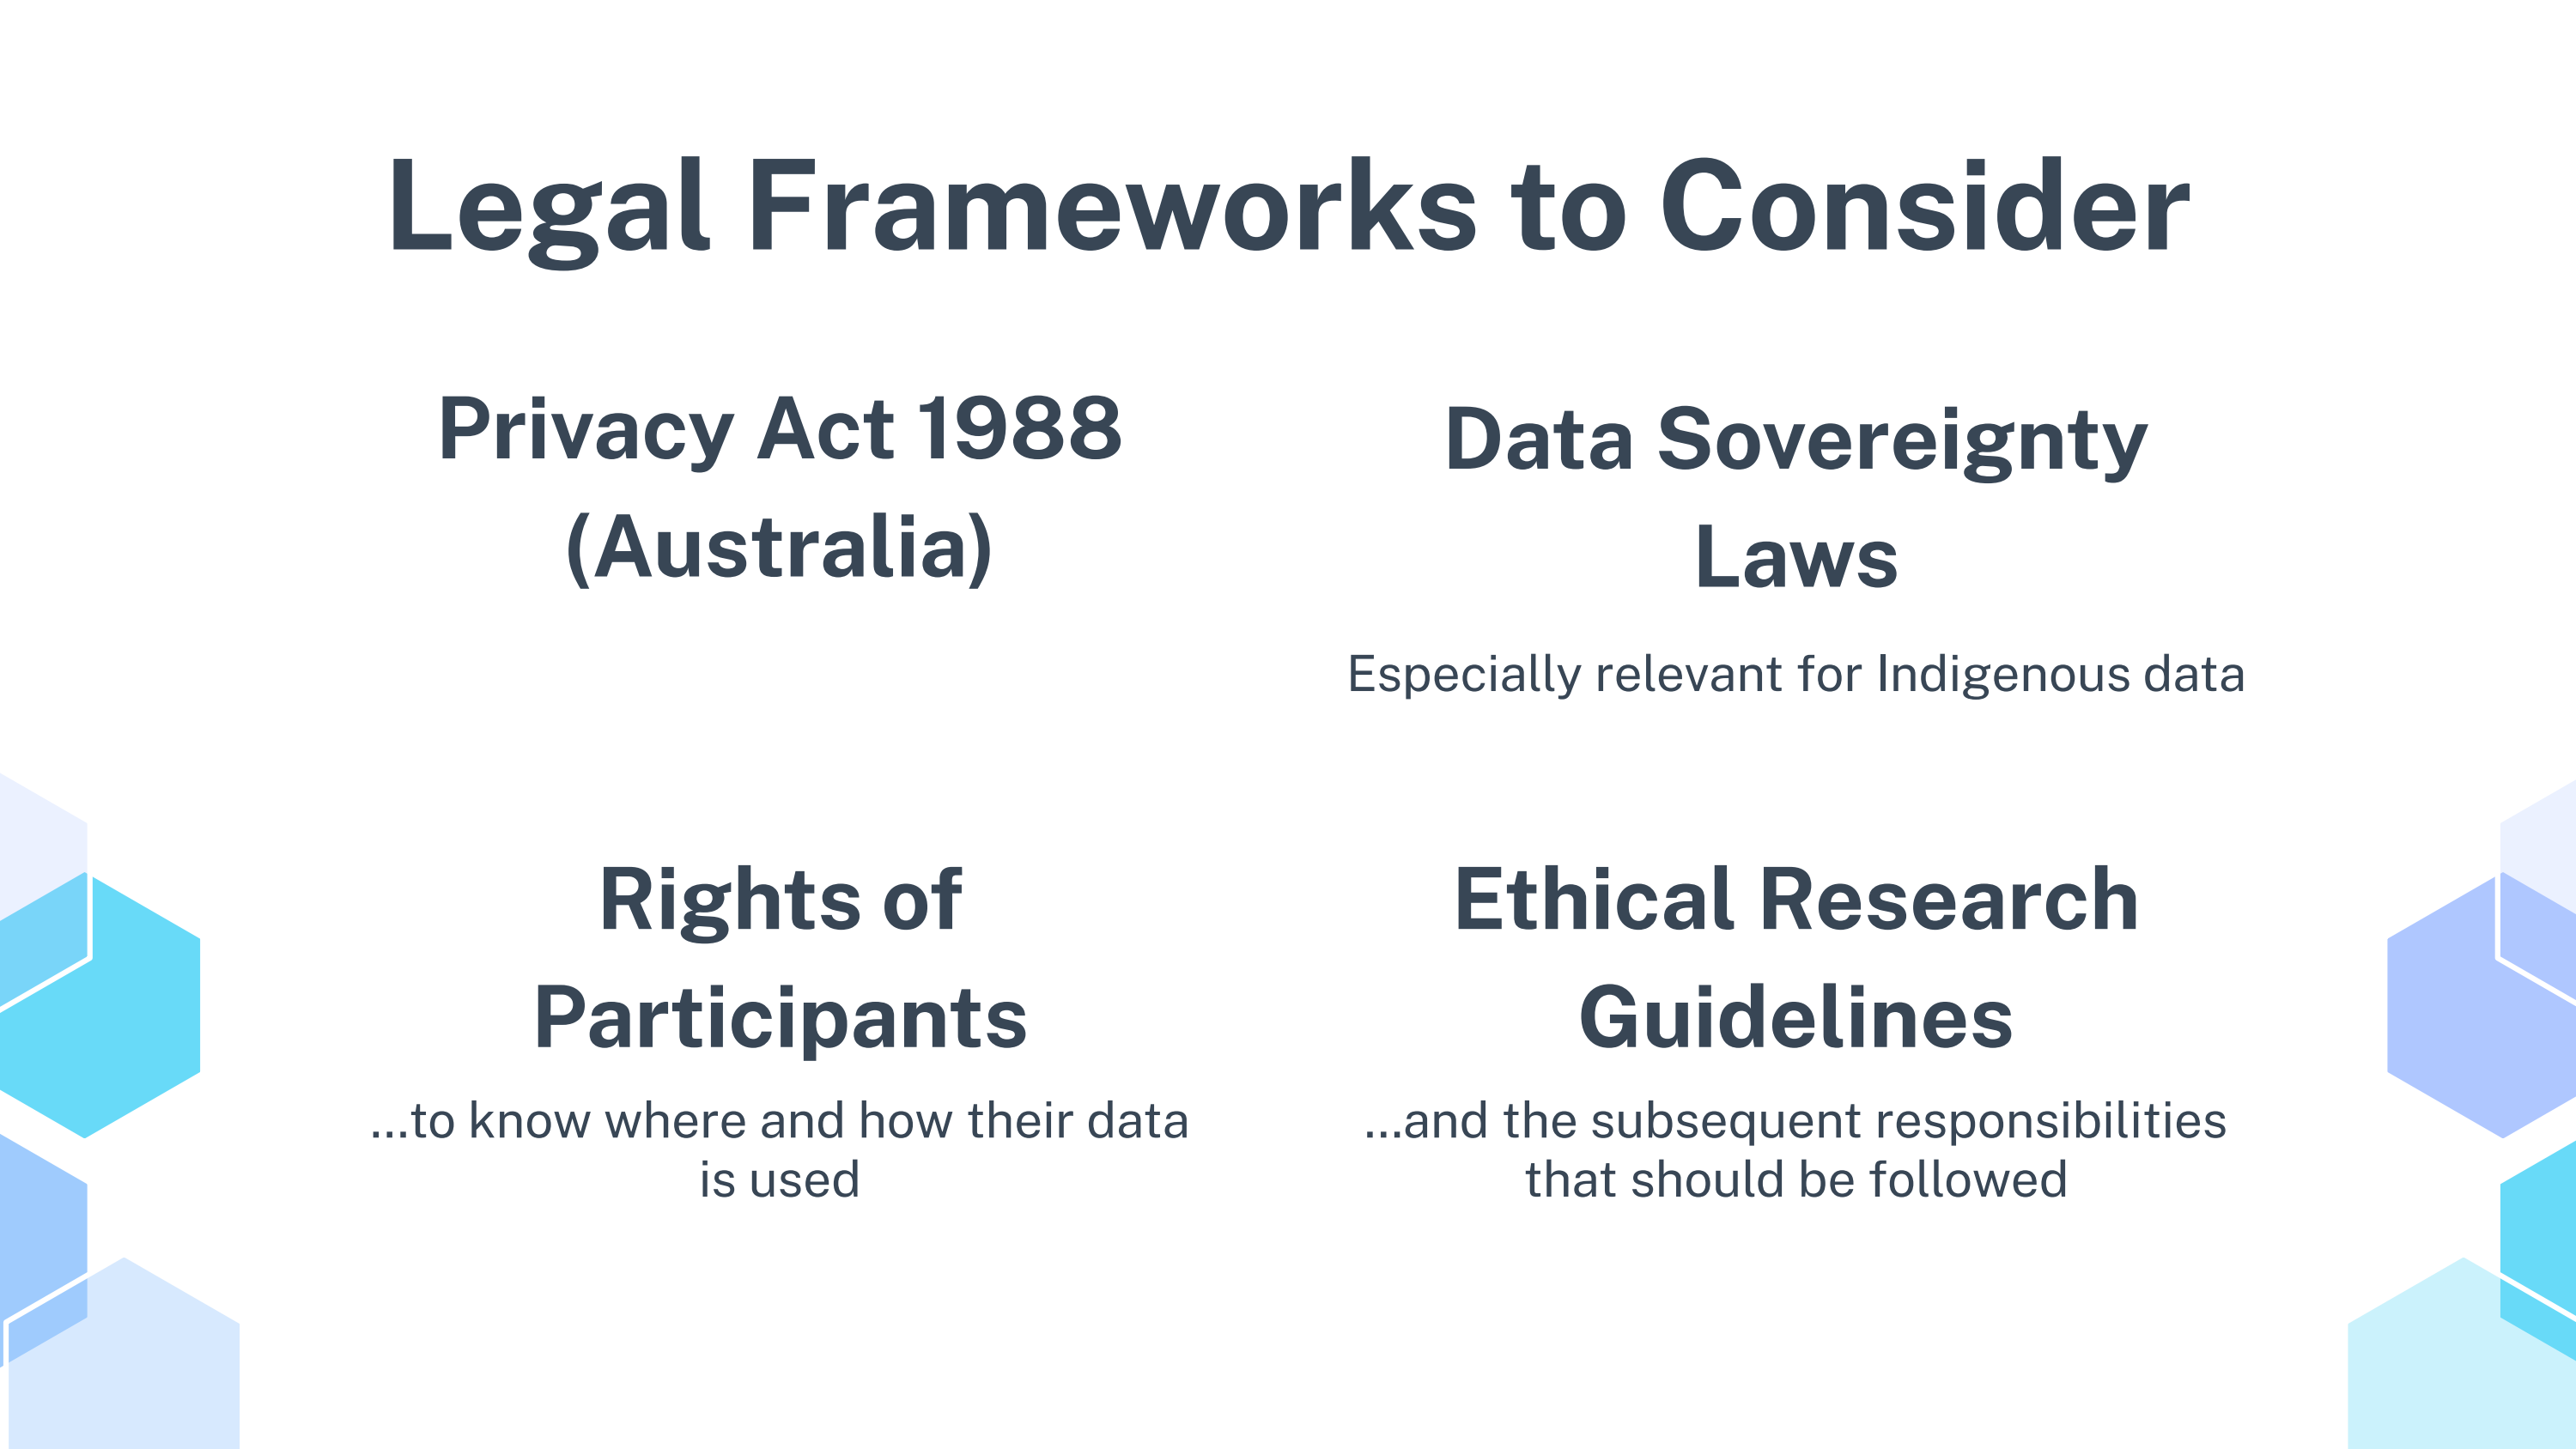
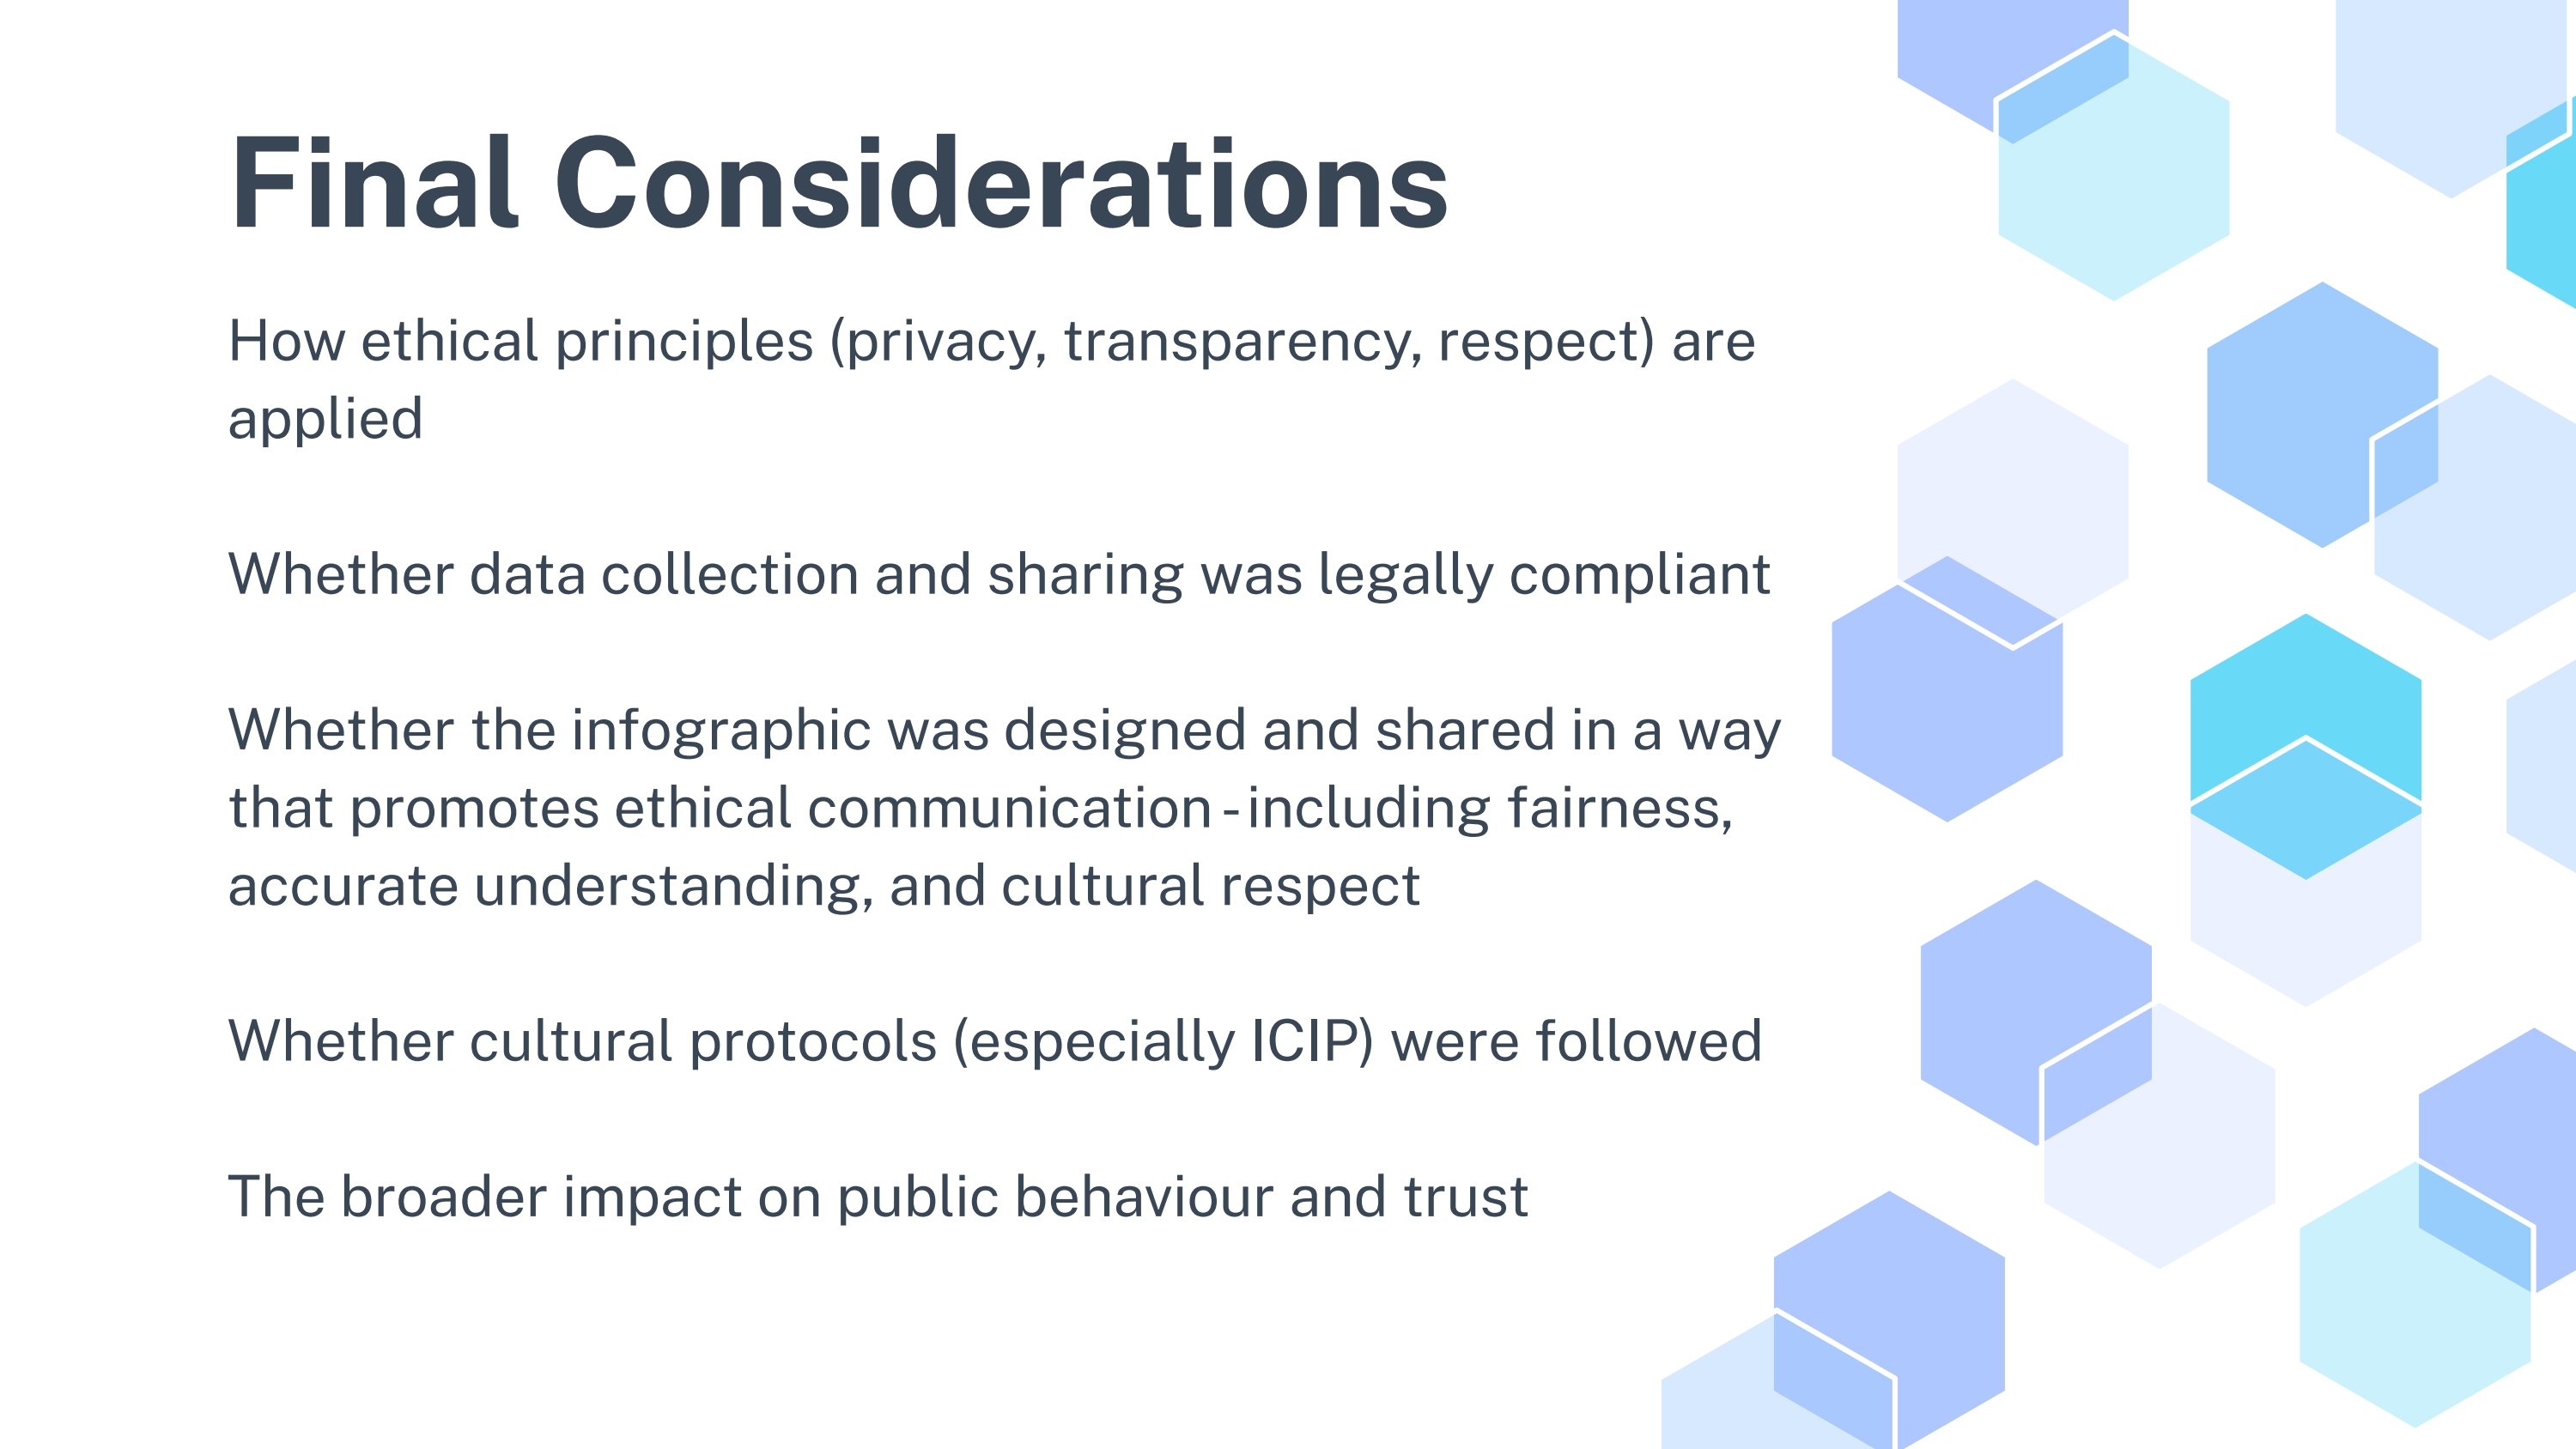
Assess the social, ethical and legal considerations in this scenario relating to the collection, use, and publication of data. Support your answer with information from the slideshow.